 S76 Handbook Graph Plotting Tips Accuracy when plotting on any graph in the APLH exam is always an issue with no easy solution other than practice and familiarity with each graph Navigation equipment is on the permitted material list for the CASA APLH exam and one valuable piece of equipment is the humble square navigation protractor The top right hand edge of any navigation protractor can be used as a scale ruler with a number of different scales available depending on where you place the protractor Each 10 degree division along that top edge shows a gradually expanding breakdown of 10 degree scales, so from 0 to 5 degrees the scale lines are closer than from 25 to 30 degrees Because you are only using a very small portion of the degree scale for any one plot, the gradual expansion will not be enough to cause any significant error in your interpolation, while the variation will make it easier for you to find a good fit on the graph This gives you a choice of scales to use on various graphs when plotting To make it easier to read those scales over the top of the grid on a graph the first thing to do is grab a white sticker or cut a piece of white paper and attach it behind the top scale on the protractor as in this photo of my 30 year old workpiece (keeping it real.. old stuff still works just fine). Actually, you can cover as much of the back of the protractor as you like, but the protractor scale beyond about 35 degrees opens up too much to be useful. If you haven't passed ANAV yet don't go glueing anything on permanently or you might need to buy a new protractor for that exam! Your navigation ruler (WAC ruler) offers yet another set of scales, so you can give it the same treatment too 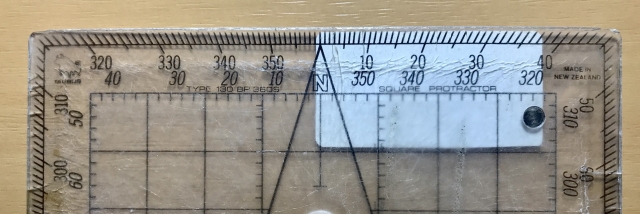 When you need to enter or read a scale on a graph simply line up the top edge of your protractor with the scale in question and slide it along until you find a degree scale that neatly matches your graph scale 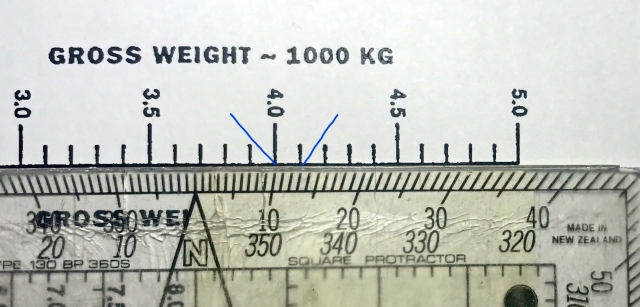 This photo shows between the blue lines how the protactor scale between 10 degrees and 13 degrees matches the graph entry scale between 4,000 kg and 4,100 kg (4.0 and 4.1 x 1000) on Page 50 - Center Of Gravity Limits While you won't always find a perfect 4 or 5 division split to give 1/4 or 1/5 breakdowns, in this case we have even 1/3 rd's which can easily be broken in half into even 1/6 th's or about 17 kg per division. Finding the half way spot of 4,050 kg is also easier using this scale than just guessing Next photo shows using the protractor to determine a weight limit from the OEI ROC Graph on Page 23. 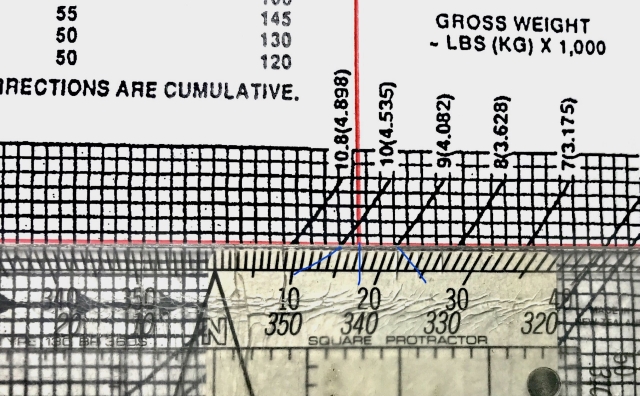 The protractor scale between 15 degrees and 21 degrees matches closely the length of the line across the grid from 10,000 lb to 9,000 lb with the breakdown being 6 divisions between the diagonal blue lines drawn on the image So as best my glasses can read that I see the crossover as being 4 divisions above 9,000 lb out of a 6 division split, so 4/6 x 1000 lb between marked weight scales gives 667 lb added to 9,000 or 9667 lb (4384 kg) weight limit It can also be read as being 2 divisions below 10,000 lb out of a 6 division split, so 2/6 x 1000 lb between marked weight scales gives 333 lb subtracted from 10,000 to end up with exactly the same answer of 9667 lb (4384 kg) weight limit You can also see from the photo there is a square grid already overlaid on the graph, but that grid will rarely fit exactly end to end across the line you have ruled, so while the overlaid grid can be used it's not as accurate as the protractor scale once you find the best fit There is no reason why you can't split the protractor divisions themselves into whatever smaller unit your eyes can comfortably read, so on a different graph calculation you might for example read 2.8 divisions out of seven divisions as your fraction to interpolate as in this next photo (I know we are pushing the edge of the practical visual accuracy envelope here, but the principle behind the plot is solid.The lines on the photos are drawn with my fat fingers on a touch screen for a demo of the concept only) 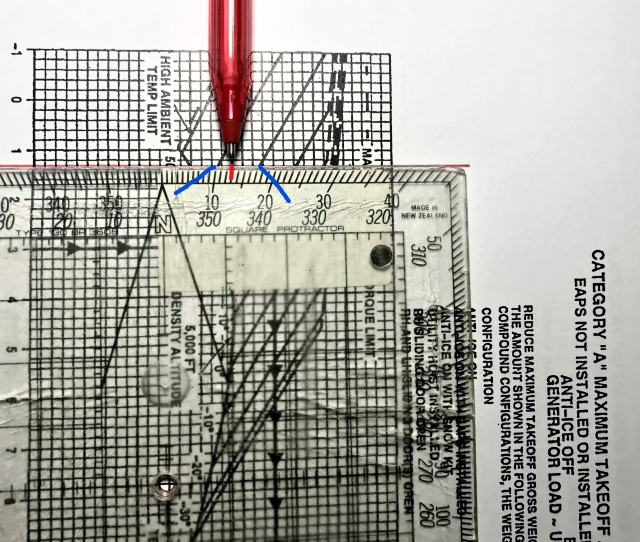 Here is an example of using the protactor scale to mark an OAT on the Cat A MTOW graph from Page 30. We need to mark a line across from 34 degrees C at right angles to the red PA line already drawn left to right. On the protractor the scale we see between 10 degress and 17 degrees fits nicely across the OAT scale between 30 C and 40 C. We need 34 C, so 4 degrees above 30 C. Our fraction to plot is 4/10 x 7 protractor divisions = 2.8 protractor divisions, which we can then plot as best we can. It's not perfect, but it's better than a random guess. As before to plot 34 degrees C you could also come down 6/10 x 7 divisions = 4.2 divisions from the 40 degree C end and get the exact same position This method of reading scale with the protractor works on pretty much any graph where you are trying to get those last few Pounds/Kilos/FPM/OAT/PA/MM CG position sorted for an answer NOTE - From the different photos you can see to the left and right of the white sticker on the protractor, where the underlying graph is visible and the view is very confusing and hard to track. That's the reason for the white sticker. It covers the maze of lines and allows you to simply focus on only the lines you are interested in. Give it a go if this is new to you - Wazza Please Click Here to return to the login page. |